Business Intelligence
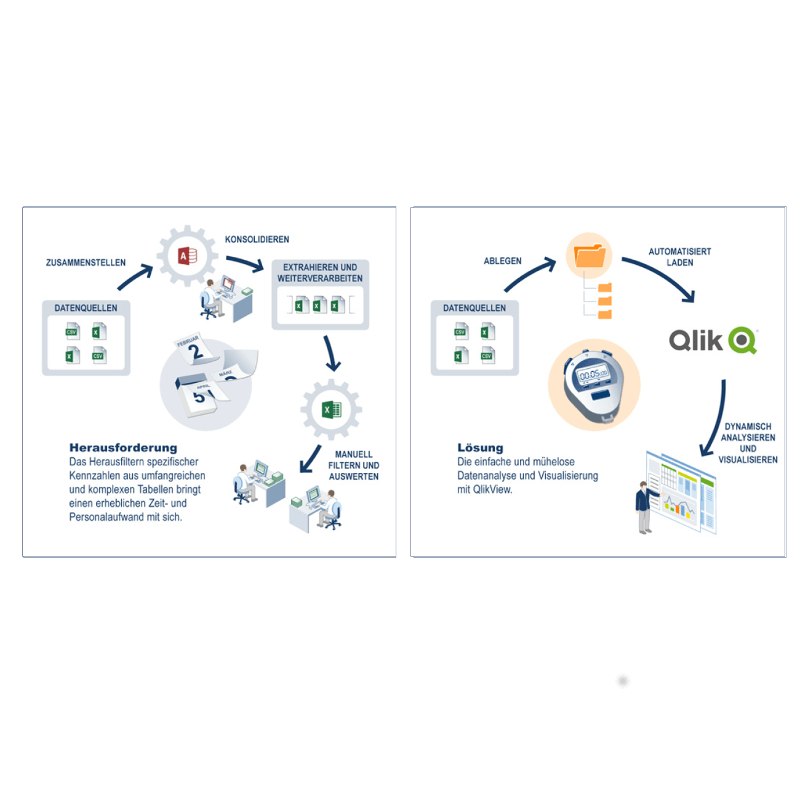
The Challenge
Our customer, Deutsche Telekom AG, is one of the world’s leading integrated telecommunications companies. Their products and services can be found in the areas of landline and mobile communications, Internet, IPTV and VoIP (Internet TV and telephony).
The Service and Demand Management department (SDM) deals with the estimation of required resources and capacities to optimize the staff planning and other areas of responsibility. In the course of that, they regularly consolidate planning and actual data from various sources (usually Excel and CSV based ones), which are all transferred into Access databases in a CSV format. For later analysis and processing purposes, Excel spreadsheets are extracted from Access again. It implies a considerable effort of time and personnel to filter out specific operating numbers from these extensive and complex tables. To reduce this effort and to enable a constant availability of these operating numbers, an easily applicable solution for the compilation and analysis of the data is required.
- Use Case
Deutsche Telekom AG
- Goal Setting
- Optimization of extensive reporting processes
- Technology
- QlikView
The Solution
To create a standardized data delivery system and thus be able to automatically generate operating numbers from the data tables, TIQ Solutions has implemented QlikView® at the SDM department. QlikView® is an associative data analysis software. Due to its ease of use, data can be analyzed and visualized effortlessly, which is why completely new insights into the world of sales data are possible. QlikView® in the Service and Demand Management department is mainly used for the analysis of:
- Products & Product groups
- Regions
- Distribution channels & segments
- Success monitoring
- Forecasts
- Customer groups
The Result
The use of QlikView® enables a quick access to the data needed for the market planning and provides a clearer presentation of these. Now, the SDM department can evaluate planned sales and actual quantities, on the basis of various issues regarding the market development, easily on an interactive user interface. Especially the calculation of forecast values in relation to actual values as well as the delta of several forecast deliveries, which were integrated into the QlikView® system, ensures a significant added value. The operating numbers and visualizations rapidly acquired by QlikView®, can easily be used in Excel or PDF for further processing and evaluation. In addition to a consolidated view on the data and the availability of a longer data history, this automation of the reporting system with QlikView® enables enormous time savings as well as a general process simplification.
- Benefits
- Process automation
- Longer data history
- Staff relief /Relief of personnel
- Time saving
- Data overview
Graphic