Let your data speak with Power BI
Microsoft Power BI
Power BI is a collection of reporting services, apps and connectors from Microsoft and part of Office 365. With Power BI you can connect data sources, analyze data, present it in the form of interactive dashboards and share it with others. Thanks to the Office-style development environment, even new users can create custom reports quickly and easily. Power BI consists of various elements that are closely intertwined.
- Desktop
- iOS / Android
- Online service
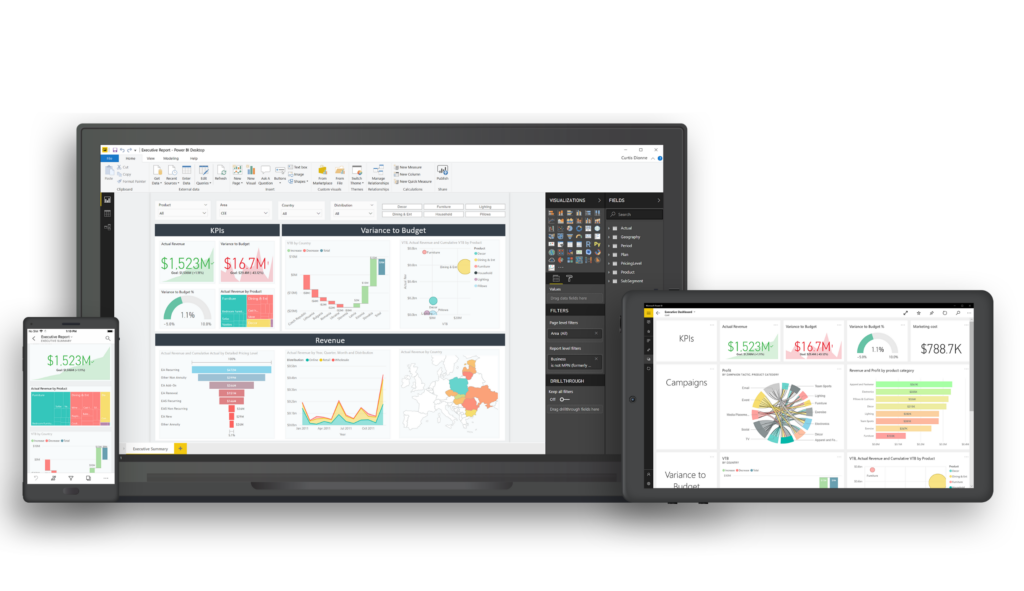
3 core components
Desktop
Windows desktop application for BI developers to combine, analyze and visualize data from various data sources.
iOS / Android
View shared dashboards and reports with the app for Windows, iOS, and Android devices.
Online service
Online software-as-a-service (SaaS) for creating and publishing reports.
Benifits
Take advantage of Microsoft Power BI
Get fast answers by tapping into disparate data sources and merging them into effective and interactive visualizations. This allows you to make convincing decisions quickly and confidently with up-to-the-minute analysis.
Real time analysis
Real-time analytics enable fast decision-making.
Business
intelligence-platform
An integrated business intelligence platform enables easy integration, preparation, modeling, analysis and visualization of data.
Self service analyse
So that everyone in the company can intuitively create individual reports even without developer knowledge.
iOS / Android App
With the Power BI mobile app, analyses can be visualized at any place at any time.
Alerting
Be immediately informed when data changes.
Templates
Predefined templates allow quick deployment without tedious configuration.
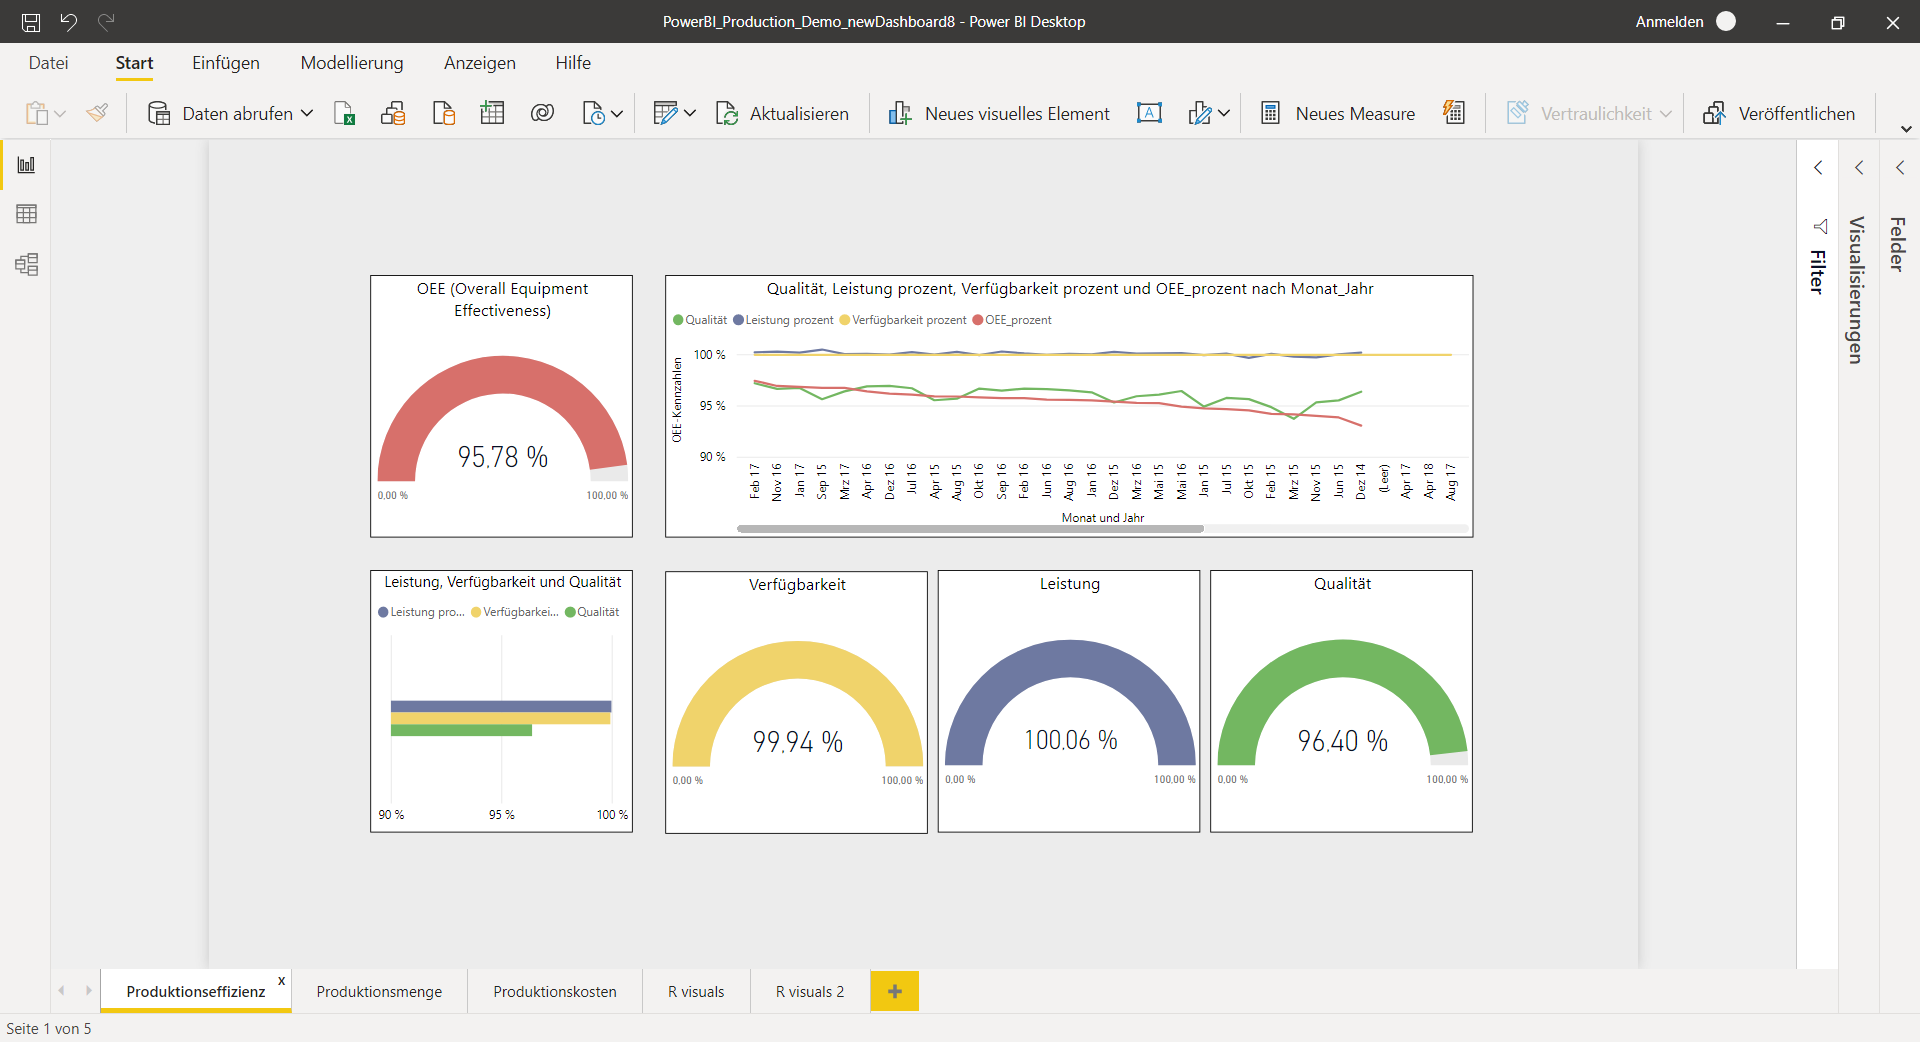
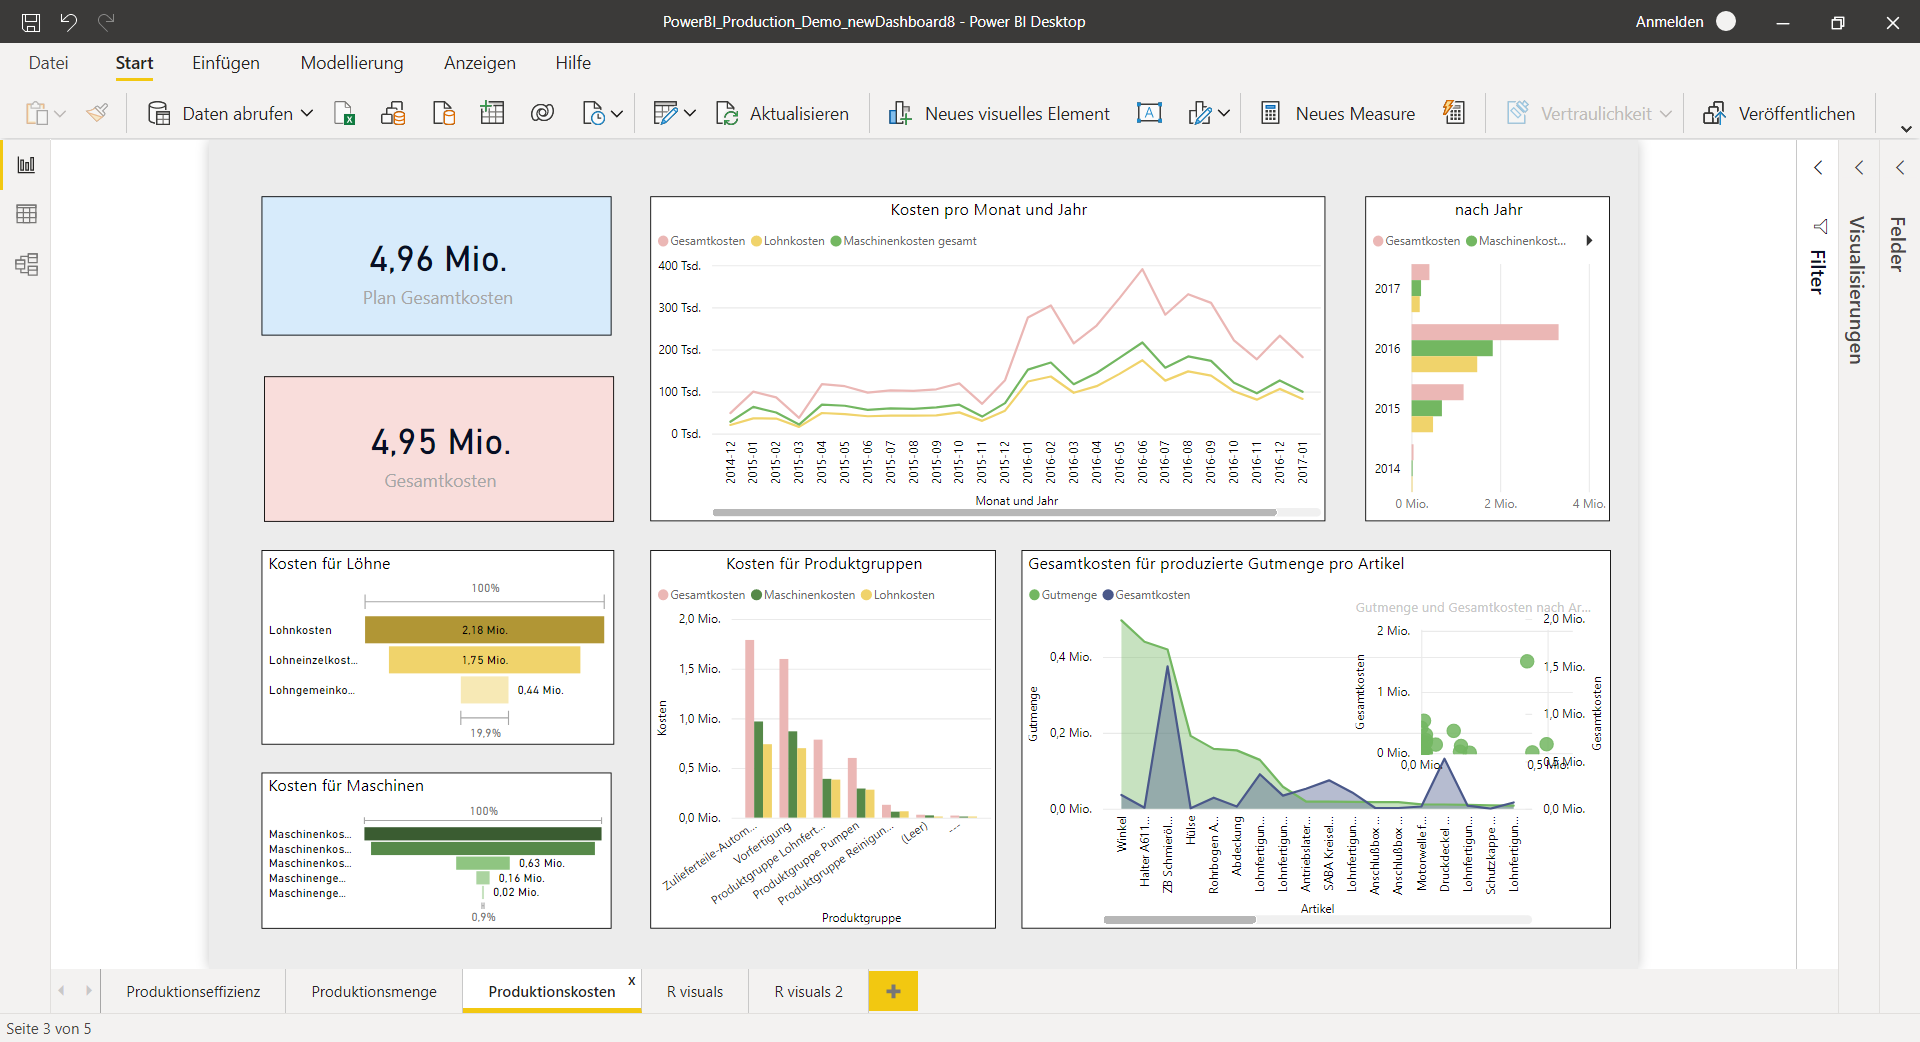
Visualization samples
Below you will find 3 examples of visualization of different data sources.

We support you iteratively and agilely
Our approach for your Power BI application
1
Requirements & setup
Together with you, we analyze your requirements, information needs and questions in a kick-off workshop. To do this, we determine which business processes need to be automated and which data is required to support these processes. In this way, we define the dimensions and metrics to serve in the Power BI application. At the same time, we identify the relevant data sources from which the data will be extracted and subsequently loaded into Power BI.
2
Prototyping
For the first relevant use case, we develop a prototype of the Power BI application according to the requirements. For this purpose, we create the necessary data models as the basis for the dashboards and visualizations. In doing so, we place particular emphasis on ensuring that your data is displayed in a visually appealing, easy-to-understand and flexible manner. We also pay special attention to data quality and data integrity. Now it's your turn to review the prototype with your team to ensure that all requirements are met and a smooth deployment is guaranteed.
3
Rollout & training
After you have extensively tested and evaluated the prototype, we optimize the application according to your experience and findings before we launch it to other user groups. In the process, we set up additional workstations for your teams and further develop the data models according to business requirements. We also create the appropriate authorization concept for the application. During the rollout, we provide appropriate user training to ensure that your teams use the application effectively. We are always available to provide you with professional and technical support.
Get advice from our Power BI expert
Power BI in your company
Our experienced BI team will support you in the implementation of Power BI in your company. You will receive support with:
- Definition of issues, goals and milestones and analysis of requirements, intersections, key figures and coordination with system administrator and business user
- Design and piloting of the future Power BI solution
- Data modeling and setting up the processes and development of the front end
- Training of users
- Testing and optimization / redesign of existing applications
