Discover new insights and trends for innovative decisions
Qlik Sense
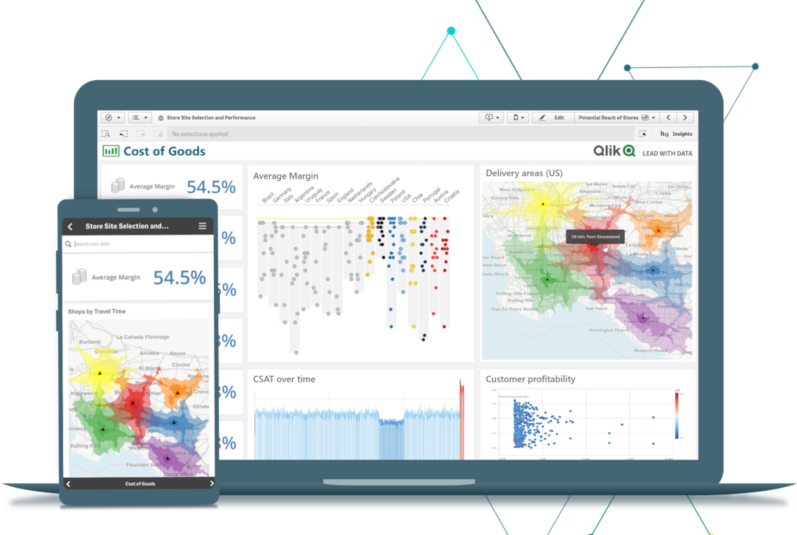
With Qlik Sense, you can analyze data from multiple data sources at all levels, create drag-and-drop visualizations, and see direct relationships in a flash - all intuitively and without development experience. Take the guesswork out of making intelligent decisions quickly and confidently, and get answers to questions you never asked yourself before.
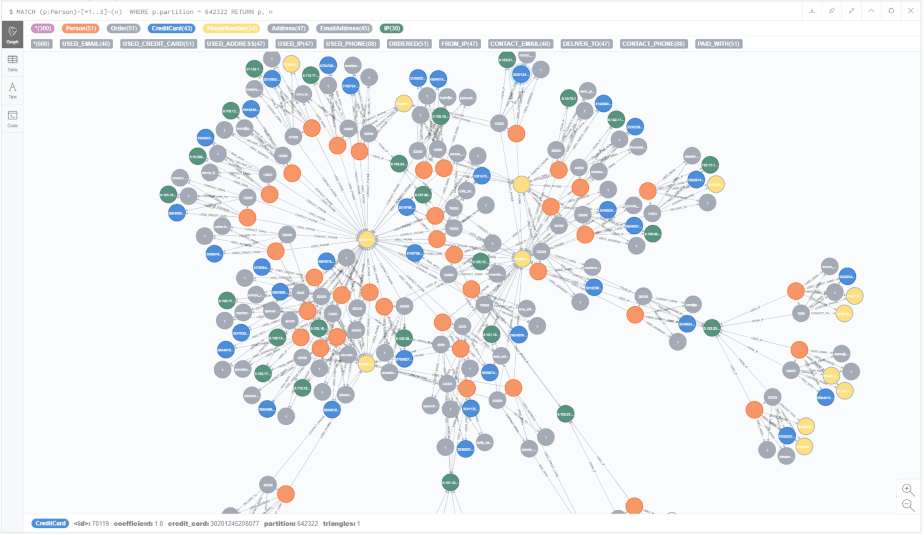
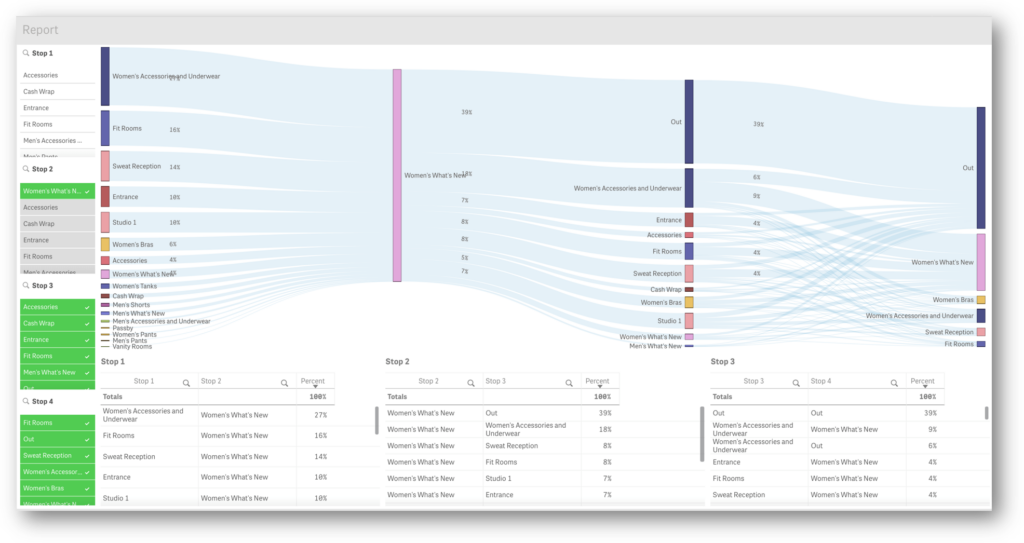
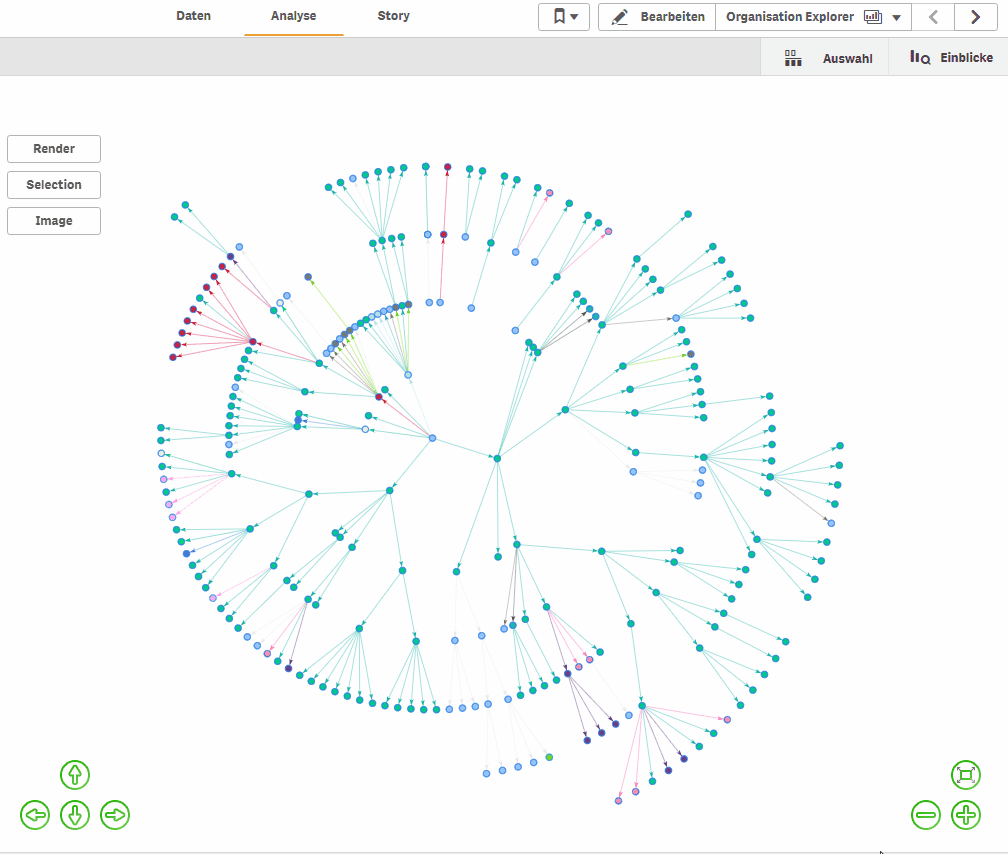
Learn about the unlimited data analytics capabilities Qlik offers businesses across all industries and functions. Fraud detection, in-store analytics, human resource management, sales controlling, social media analytics and graph visualizations are some of the Qlik solutions TIQ Solutions has developed in this area.
- Desktop
- iOS / Android
- Online service
Benifits
Benefits of Qlik Sense
Get fast answers by tapping into disparate data sources and merging them into effective and interactive visualizations. This allows you to make convincing decisions quickly and confidently with up-to-the-minute analysis.
Collabaration
to find and share different analyses and insights in the team
Simple data integration
from different data sources through mashups
Self service BI
intuitive, drag-and-drop user interface that lets users visualize data quickly and easily
Smart search
for an even faster search
Responsive design
access from any device, anywhere, anytime
Inference mechanism
automatically establishes associations and connections between the data
Visualization samples
We support you iteratively and agilely
Our approach for your Power BI application
1
Requirements & setup
In cooperation with you, we analyze your requirements, information needs and issues. To do this, we determine which business processes should be automated and which data is needed to support these processes. In this way, we define the dimensions and metrics to be used in the Qlik Sense implementation. At the same time, we identify the relevant data sources from which the data is to be abstracted and subsequently loaded into Qlik Sense.
2
Qlik proto type development
For te first relevant use, case we develop a prototype of the Qlik Sense application according to the requirements. For this purpose, we create the necessary data models as a basis for the dashboards and visualizations. In doing so, we place particular emphasis on ensuring that your data is presented in a visually appealing, easy-to-understand and flexible manner. We also pay special attention to data quality and data integrity. Now it's your turn to check the prototype with your team to make sure that all requirements are met and that a smooth deployment is guaranteed.
3
Qlik Sense application rollout
After you have extensively tested and evaluated the prototype, we optimize the further according to your experience and findings before will then be rolled out to further user groups. For this purpose, additional streams will be set up for your teams and the data models are enhaced to meet the business requirements. In addition, we create the appropriate authorization concept for the application. During the rollout, we provide adequate user training to ensure that all members of your teams use the application effectively. We provide you with professional and technical support at all times.
The right solution for any problem
Get advice from our Qlik experts!
As an implementation partner of Qlik, we support you with a team of experienced and certified BI / Qlik experts at:
- conception and project planning
- development of a prototype and implementation of the Qlik application
- data modeling and visualization
- user introduction and training
- testing and health checks (optimization of your Qlik environment)
- migration from QlikView to Qlik Sense

Further TIQ Services for Qlik Sense applications
Qlik-Sense automation
Extend your data capabilities with Qlik Sense APIs to read, analyze, and reason with data. The APIs allow you to combine Qlik Sense with other tools and technologies to increase the power of your data.
Health-check for Qlik-Sense
Your Qlik applications are tested for efficiency to ensure they run smoothly and can be used optimally. Performance issues and vulnerabilities in your Qlik environment are identified and addressed to ensure maximum performance.
Migration from Qlik-View to Qlik-Sense
Existing QlikView applications are migrated to Qlik Sense to benefit from the enhanced functionality and usability of Qlik Sense. The migration takes place step by step and, if desired, also only in parts.