Data Engineering
The Challenge
The advancing digitalisation has an enormous influence on consumer behaviour. Due to the constantly growing technical possibilities, product and price comparisons are becoming easier and easier for every user. As a result, consumers are increasingly making their buying behaviour dependent on the reputation of the company or brand. The rating or image of brands and companies thus represents an increasing success factor in the marketing of products.
Our project partner from the media sector analyses the perception of companies and brands on the web in comparison to their competitors via sentiment barometers. To do this, he uses a variety of different online data sources, such as social media channels, news feeds, blogs and news portals. Until now, our partner created these analyses locally in Excel and was increasingly reaching its limits due to the high and continuously increasing amount of data. In addition, it should be possible to classify the information into topics without a time-consuming manual part. The model used so far to classify the online data into certain topics (so-called topic modelling) was not designed for large amounts of data and did not perform well enough. The naming of the individual topics from the topic modelling was also done manually and required clear standards. The effort for the analyses was therefore very high and no longer manageable for the analysts.
Our partner turned to us in their search for a Big Data Analytics solution that would enable them to analyse the perception of companies and brands from the online data sources described above and to visualise sentiment barometers from them. In the future, the analyses should be faster, more efficient and of higher quality and offer more freedom in data procurement and data selection. In the future, data modelling should be based on a universal model with a more efficient automated algorithm. In addition, the dashboards of the analyses in terms of tonality, reputation, sentiment are to be used for internal use and made available exclusively to interested clients in an appealing design.
- Use Case
PR/media sector
- Goal Setting
- Processing of very large amounts of data
- Scaling options
- Thematic classification of large text collections using machine learning
- Visualisation of the results in modern dashboard optics
- Technologies
- Microsoft Azure
- Cloudera
- Ansible
- Qlik Sense Server
- Hadoop
- Hive
- Oozie
- Spark
- ZooKeeper
- Hue
- Impala
- ADLS Client
- Sqoop
- MySQL
- Juypter Server
- Python
- R
- Qlik Sense
- Django
- Chart.js
The Solution
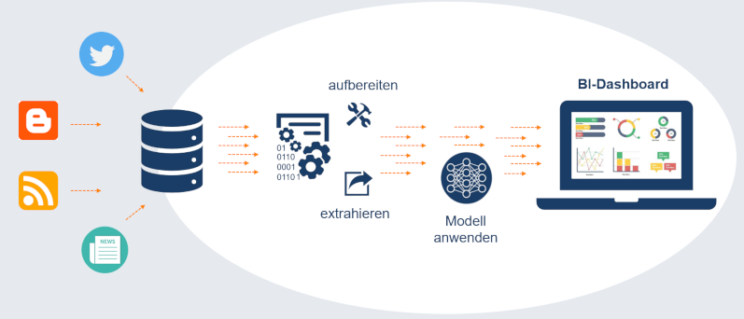
In this project, TIQ Solutions provided comprehensive support to the project partner's research and development team, from data integration to data visualisation and reporting. For Big Data integration from a variety of online data sources, the TIQ Solutions team built a Cloudera cluster in the Azure Cloud. For an integrated and coordinated fast-use environment with little administration and configuration effort, the team developed an Ansible script that sets up a Cloudera environment in the Azure Cloud in a fully automated manner in a very short time. An interface to an Amazon S3 storage was implemented for data retrieval and import. Data persistence is now done in Hive and data access was implemented using Hue (SQL) and Jupyter (Python, R).
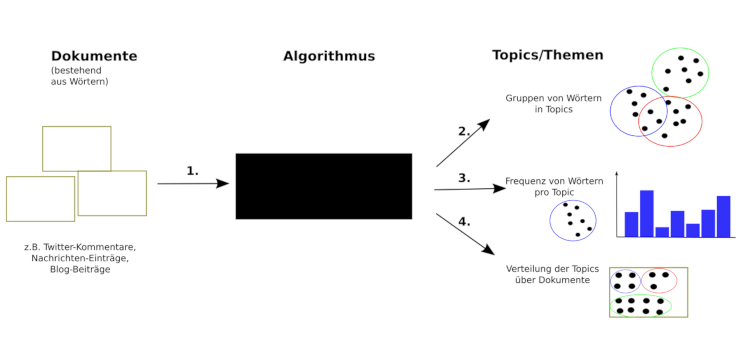
A crucial part of the (social media) analysis is the determination of relevant topics that are related to the entity under consideration. For this purpose, a topic model was first developed in R that identifies relevant topics using clustering methods. In addition, the respective topic of the loaded text fragments can be determined via an NLP pipeline developed in Python. In the aggregation, this results in the possibility of a quantitative evaluation of the topics with which companies and their benchmarks are associated. Topic modelling benefits from the scalable cloud architecture, which makes it possible to analyse even large text corpora. In addition, the classification of new text fragments has been integrated into the import of the data, allowing direct access to the topic analysis.
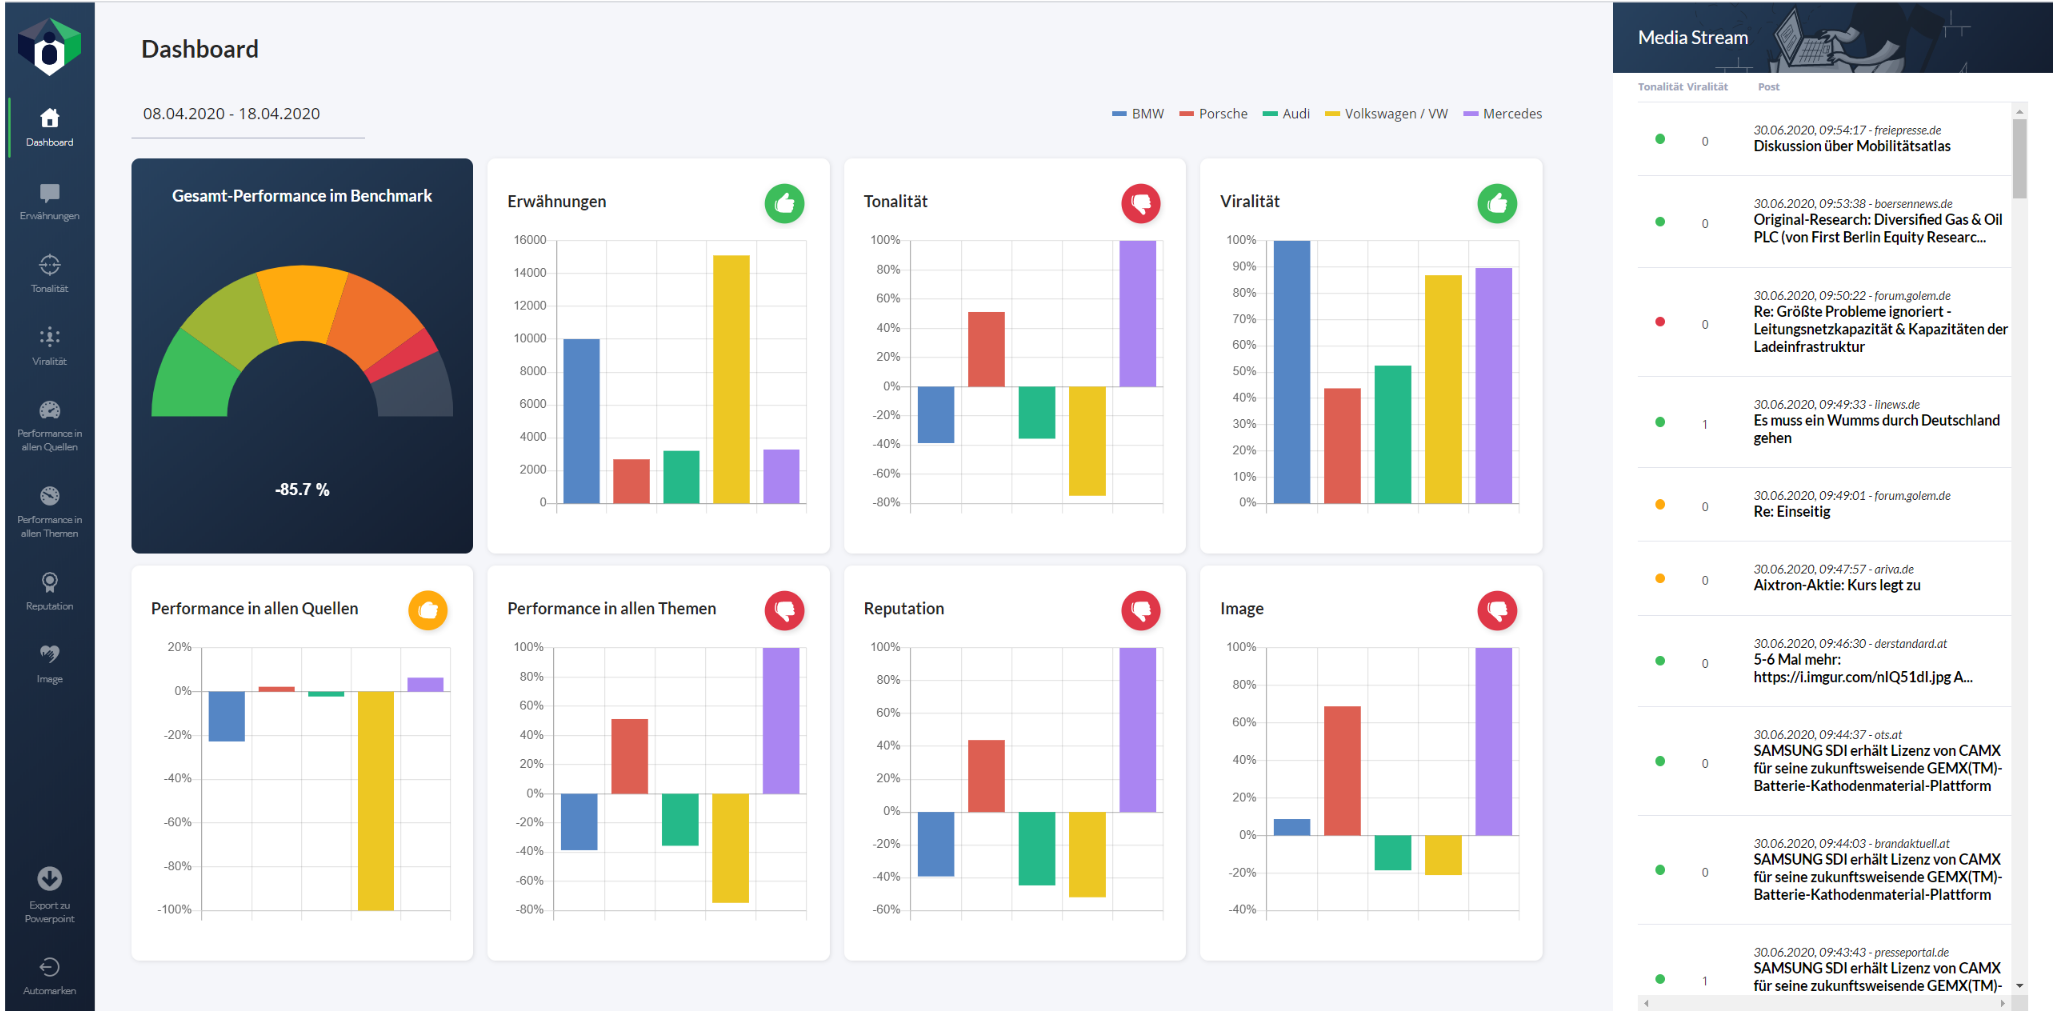
The loading, aggregation of the data and visualisation of the results is done on a Qlik Sense server, which serves as the basis for various apps and dashboards for reporting. But the data visualisation in the Qlik Sense interface did not sufficiently meet the customer's requirements. Therefore, the BI developers at TIQ Solutions developed a web application based on the Python web framework Django, on which an independent dashboard is presented. The data is not re-aggregated, but obtained via the Qlik Sense Engine API and then visualised with the help of the Chart.js framework.
The Result
For the creation of sentiment barometers from a multitude of online data, our partner can now carry out its analyses in a Big Data cluster in a transparent, optimised, fast and quality-assured manner. The analysts can obtain the required data independently and are not dependent on explicit data deliveries from a service provider. Through topic modelling, the perception of companies / brands on different topics can now be explicitly displayed and evaluated. By using Qlik Sense, our partner can independently create new analyses without any developer knowledge. In addition, Qlik Sense offers possibilities for the more flexible development of visualisations and the implementation of extended functions via the API. With the additionally developed dashboards, our partner receives a meaningful reporting, which now enables representations of further data correlations. With the provision of templates, our partner can now also offer its customers individualised dashboards for their reporting.
- Kundenvorteile
- Faster, more transparent big data analytics through Big Data architecture in Azure Cloud
- Concentration on technical analyses instead of data provision
- Improved informative value of the analyses and recognition of further correlations in the data
- Live analyses directly in the dashboard
- Options for individualisation for the dashboards also in the corporate design of the customers
- Optimal presentation of the results especially for customer presentations
Graphics